
The Results Dashboard
Visualize your hydraulic calculations like never before
From Calc to Insights in an Instant
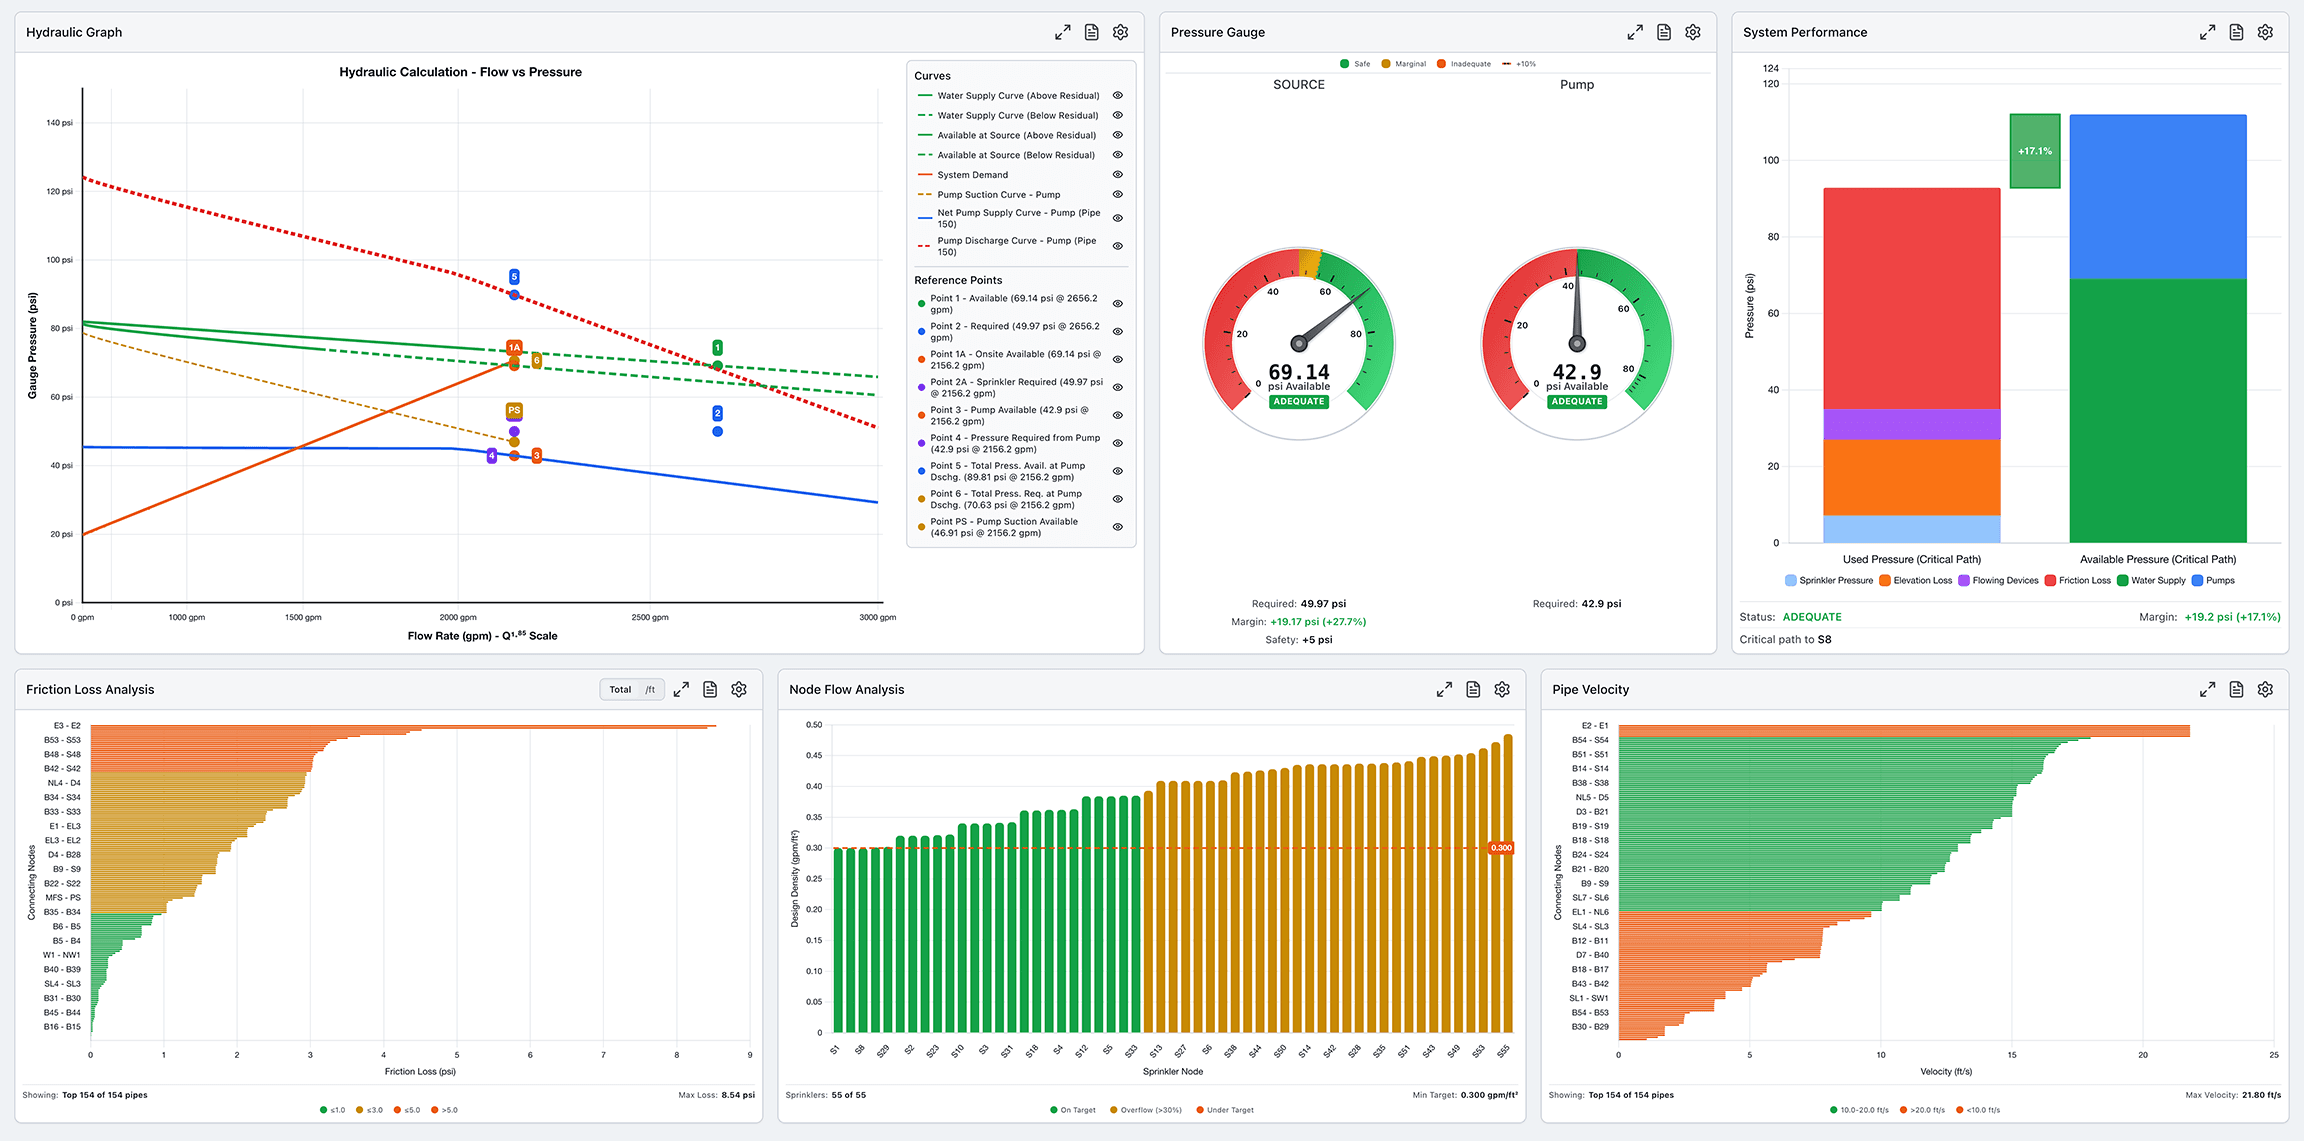
One run gives you up to eight coordinated modules that confirm whether the system meets its required density and pressure, show how much margin is left at the supply, and point you straight to the least hydraulically demanding path.
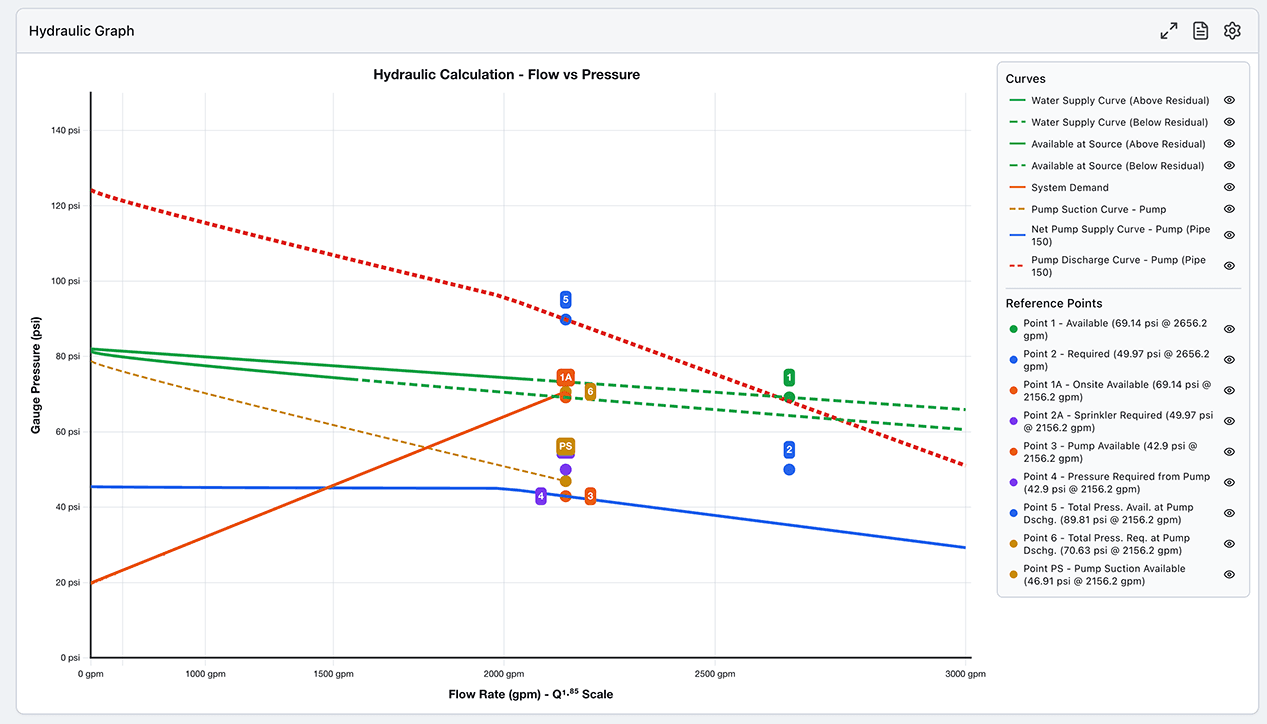
View Supply and Demand
See exactly how system demand sits against available supply for the selected run: water-supply curves, pump curves, and every labeled reference point on a single interactive chart.
Explore Your System Layout
View a complete drawing of the system, rendered to match the active calculation, with every node, pipe, and flow path in place.
Visualize your Network View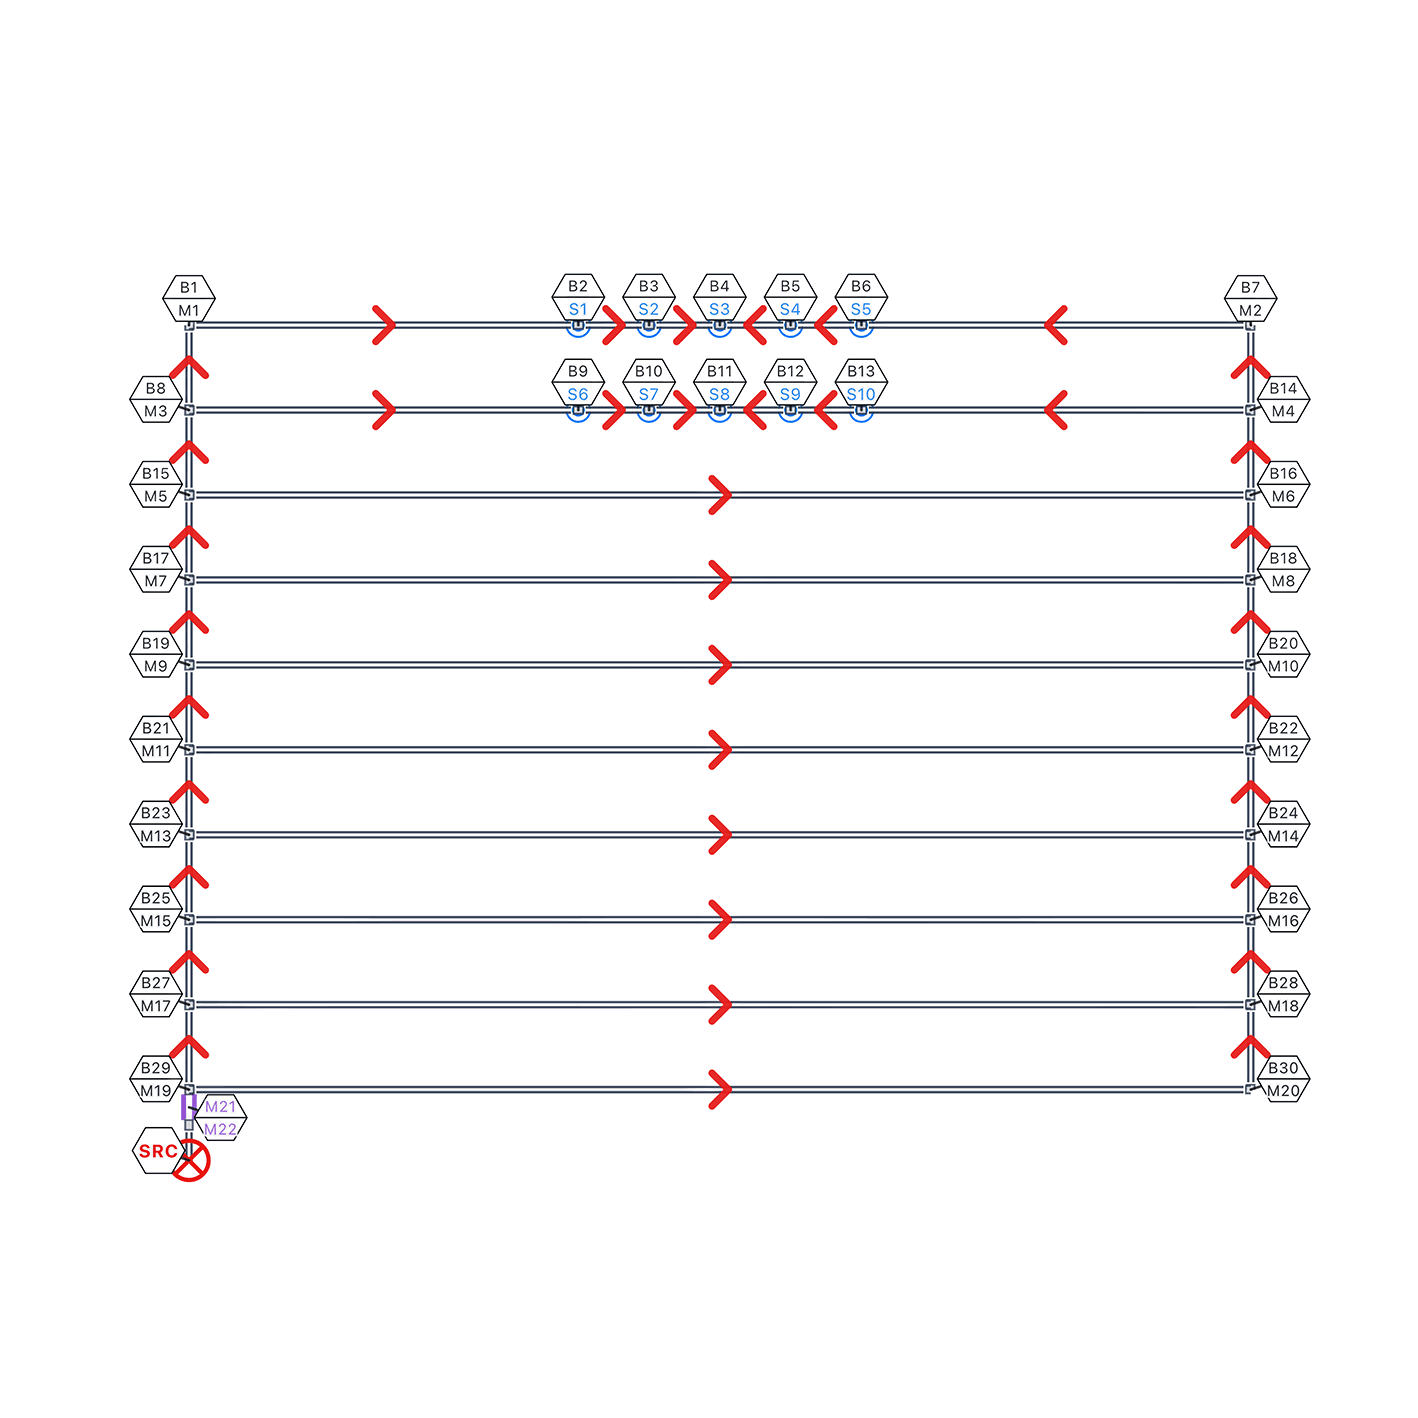
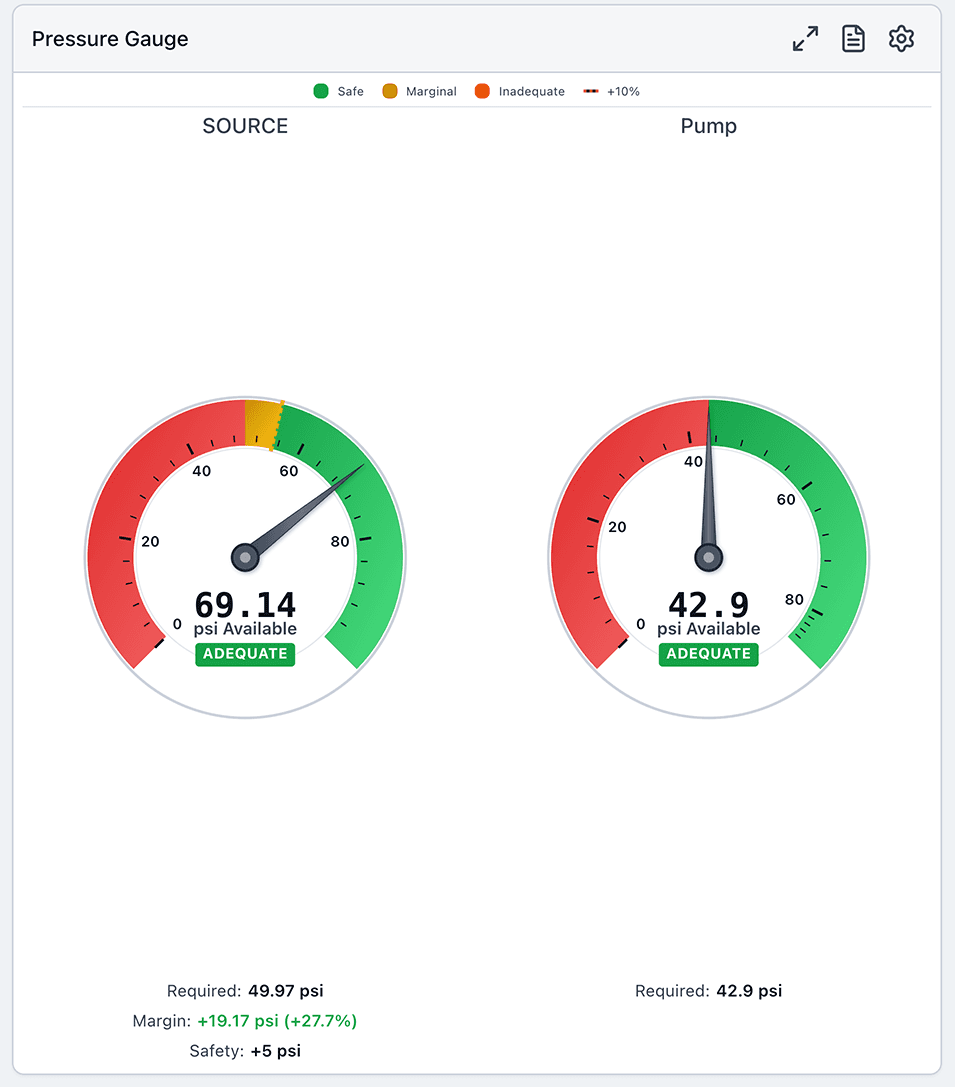
Validate Pressure at a Glance
Source and pump pressures read out on familiar dials with a clear Adequate, Marginal, or Inadequate status and the exact pressure margin, so you can validate pressure at a single glance.
Trace Your System's Performance
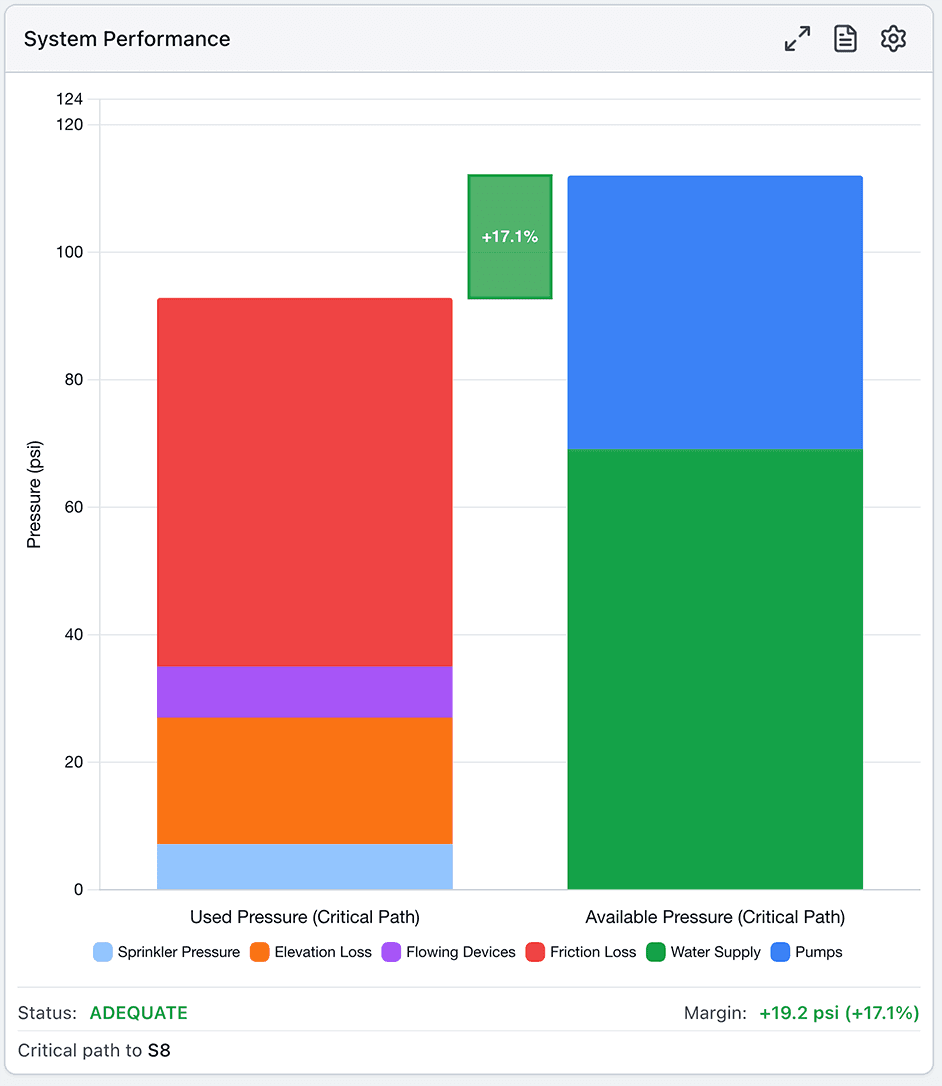
A stacked breakdown of used vs. available pressure along the critical path, with the final margin and status spelled out.
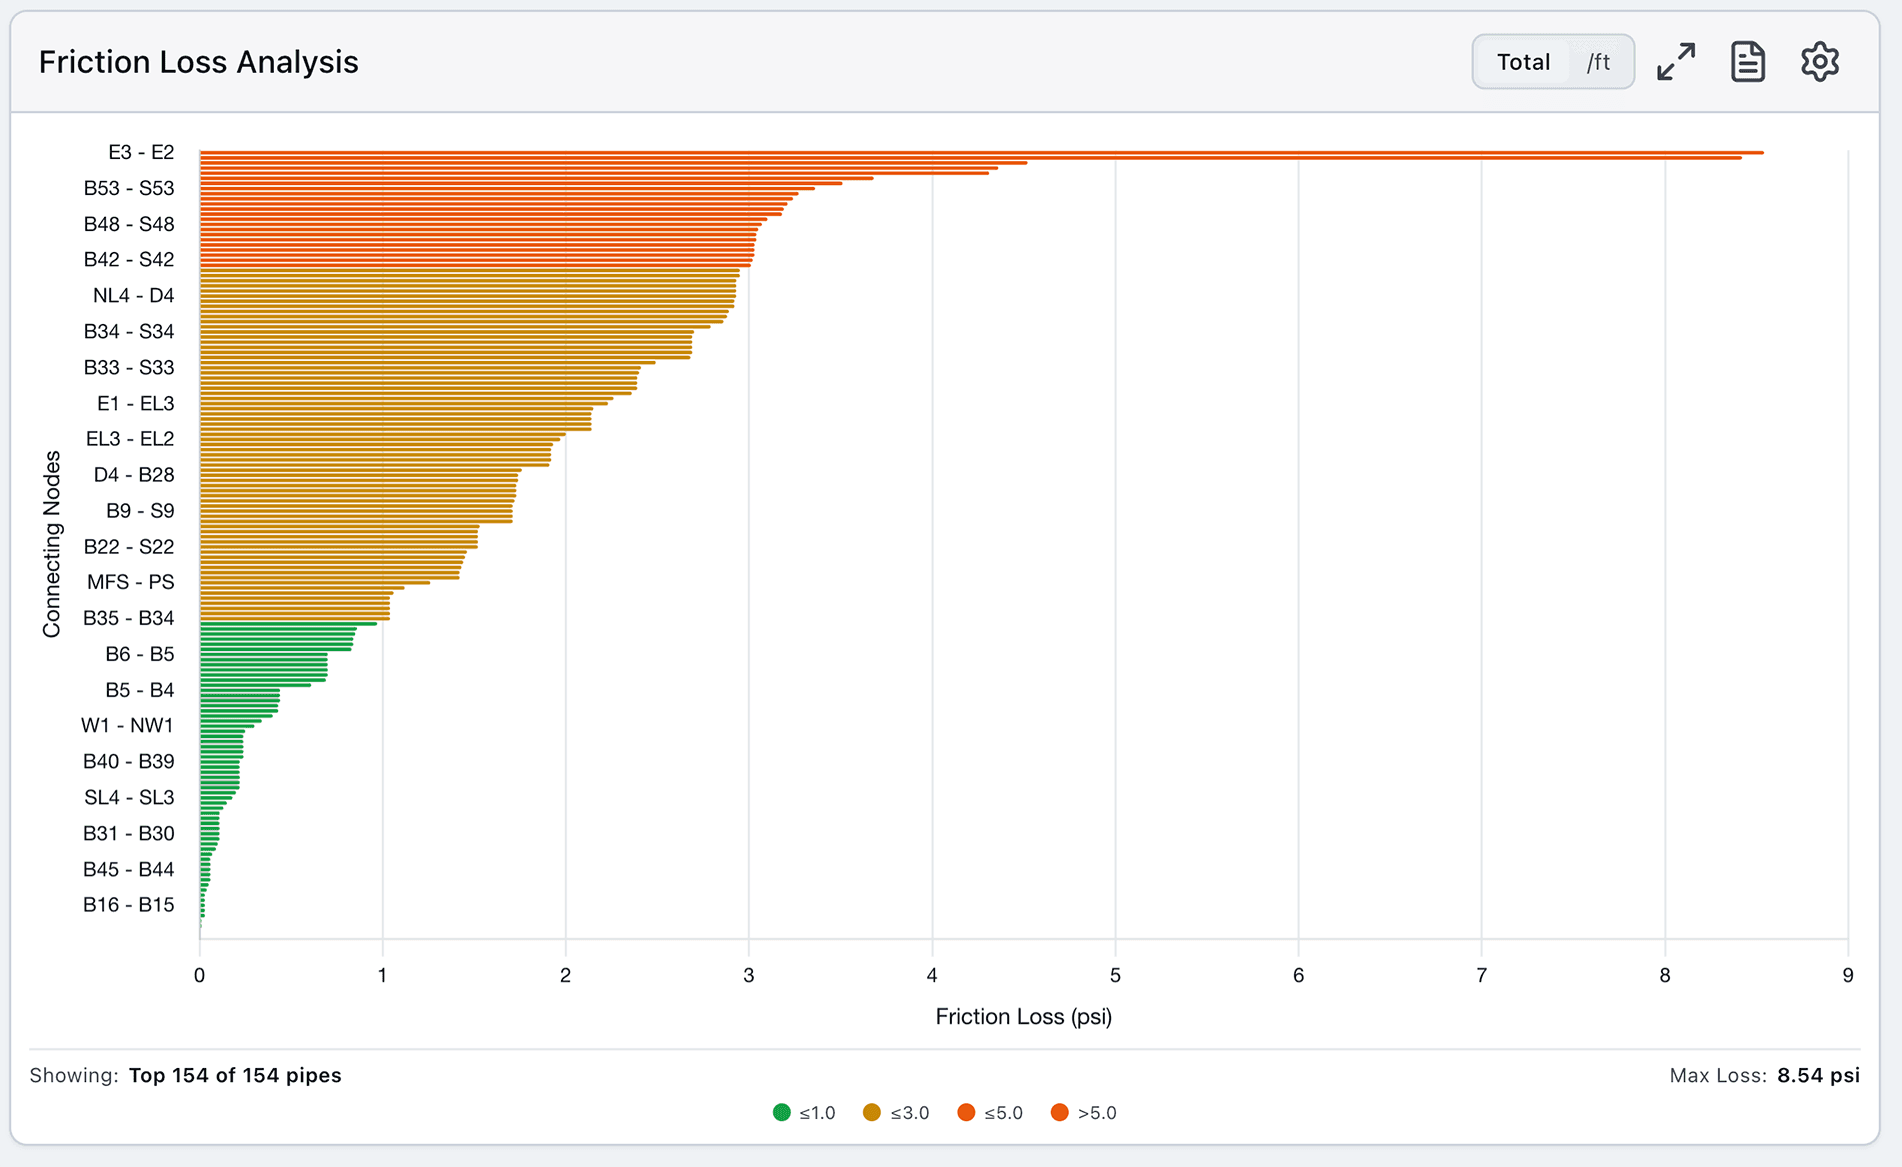
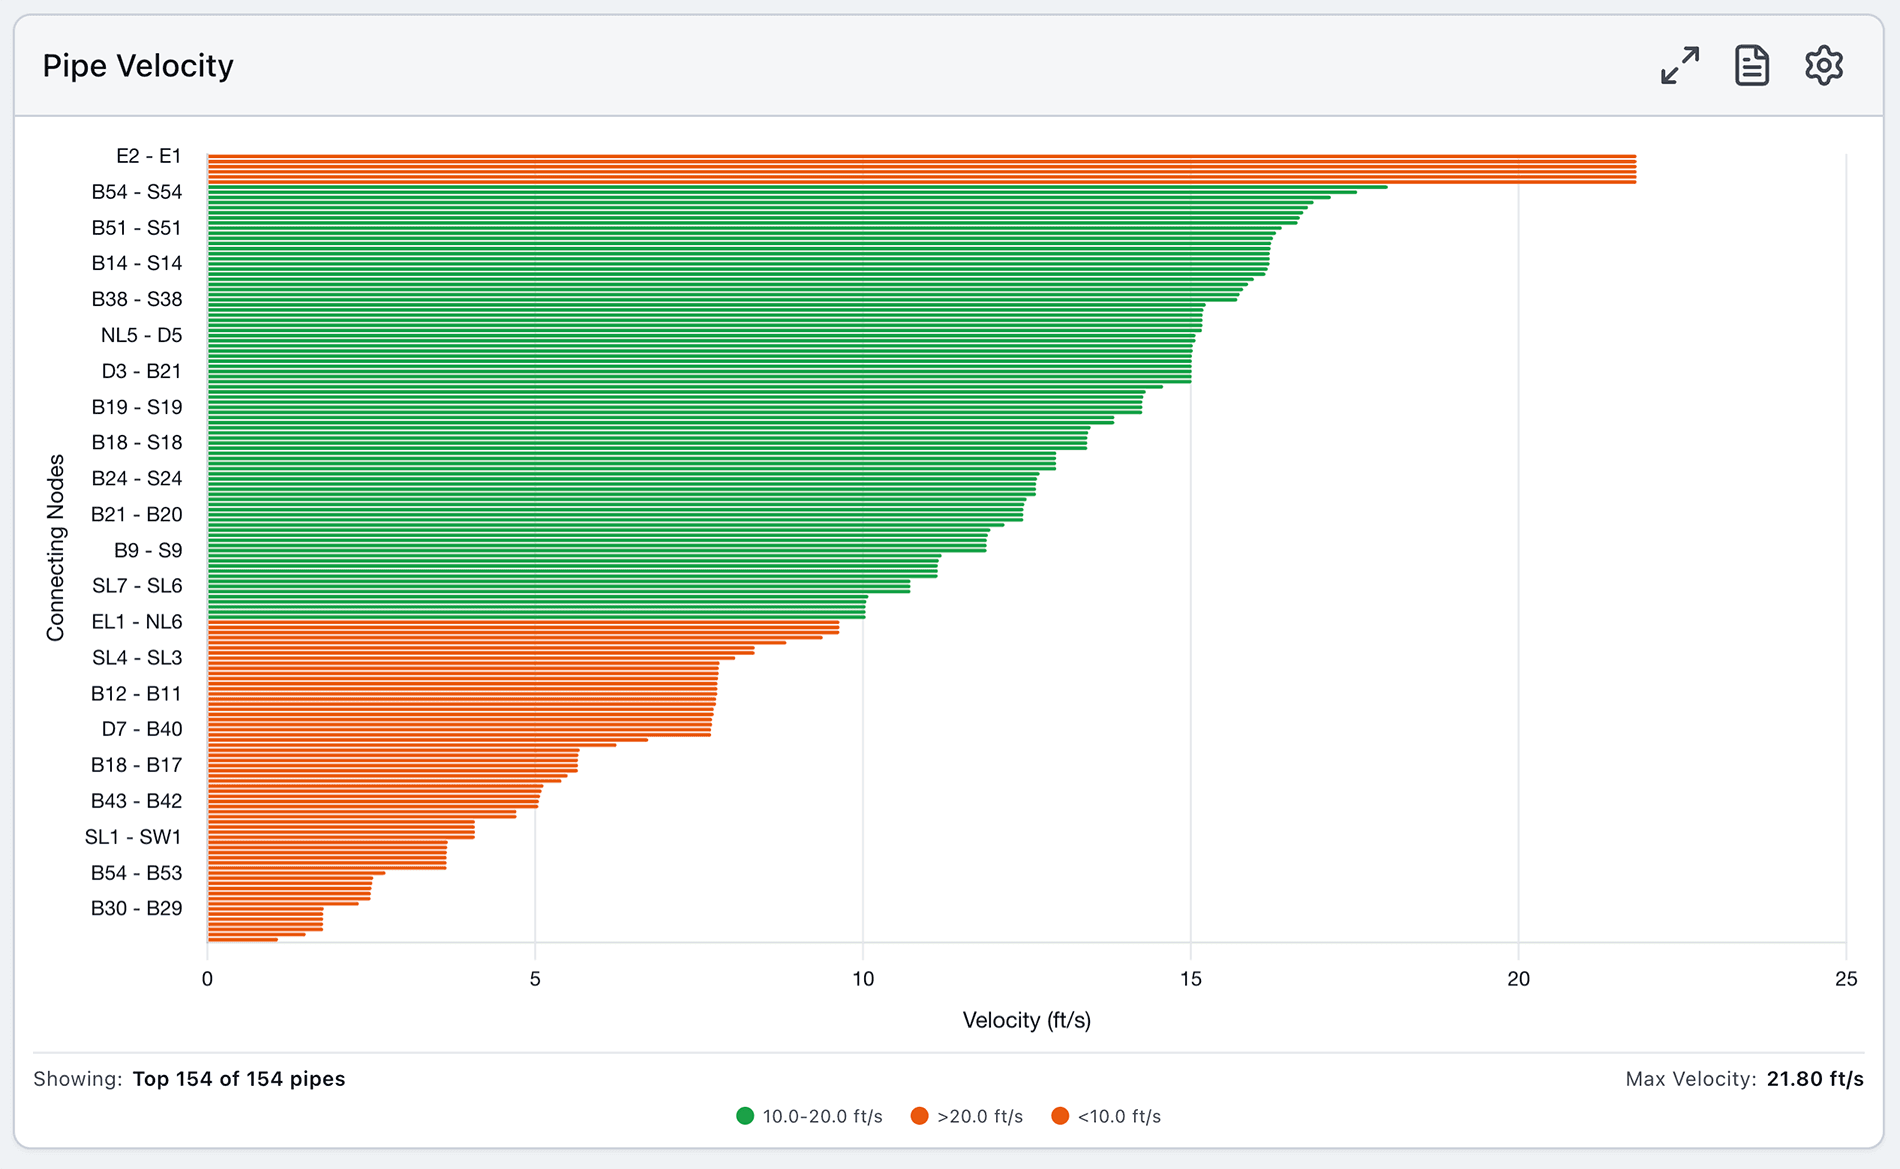
Identify Where Pressure is Lost
Bar charts surface exactly where the highest friction occurs and which pipes have the highest velocities, color-coded against your thresholds so the problem segments are easy to find.
Additional modules
- Node Analysis
- A bar chart of design density at every node, color-coded On Target, Overflow, or Under Target against the thresholds you set.
- End Head Conditions
- End-head condition checks against your selected criteria.
Try the Results Dashboard Now
Open an example HASS Cloud project and explore every module of the Results Dashboard for yourself.